Processing math: 100%
AMPS | THARC | KE8QZC | SFW | TSW | WW
ORCID iD icon

Back to the class
Section 3.1 #35: A company is conducting a survey to determine how prepared people are for a long-term power outage, natrual disaster, or terrorist attack. The frequency distribution below shows the results. What is the probability that the next person surveyed is "very prepared"?
ResponseNumber of times, f
Very prepared259
Somewhat prepared952
Not too prepared552
Not at all prepared336
Not sure63

Solution: The total number of responses is 259+952+552+337+63=2163. Therefore the probability of "very prepared" is P(veryprepared)=2592163=0.1197. Section 3.1 #40: Use the frequency distribution below, which shows the number of American voters (in millions) according to age. Find the probability that a voter chosen at random is 45 to 64 years old.
Ages of votersFrequency, f (in millions)
18 to 204.2
21 to 247.9
25 to 3420.5
35 to 4422.9
45 to 6453.5
65 and over28.3

Solution: The sum of the frequencies is 4.2+7.9+20.5+22.9+53.5+28.3=137.3. Therefore the probability a voter is 45 to 64 years old is 53.5137.3=0.3896... Section 3.1, #42: Classify as classical probability, empirical probability, or subjective probability: the probability of choosing 6 numbers from 1 to 40 that match the 6 numbers drawn by a state lottery is 13,838,3800.00000026.
Solution: Classical probability -- this problem can be analyzed entirely mathematically without looking at collected data.

Section 3.1, #47: The age distribution of the residents of San Ysidro, New Mexico, is shown below. Find the probability of Event A: "randomly choosing a resident who is not 15 to 29 years old".
AgesFrequency, f
0-1438
15-2920
30-4431
45-5953
60-7436
75 and over15

Solution: First sum the frequencies:
38+20+31+53+36+15=193. Now the requested probability is 38+31+53+36+15193=173193=0.8963.

Section 3.1, #51: A probability experiment consists of rolling a six-sided die and spinning a spinner with a 14 chance of landing on one of the colors yellow, red, blue, and green. Use a tree diagram to find the probability of the event A: "rolling a 5 and the spinner landing on blue".
Solution: First draw the tree diagram:

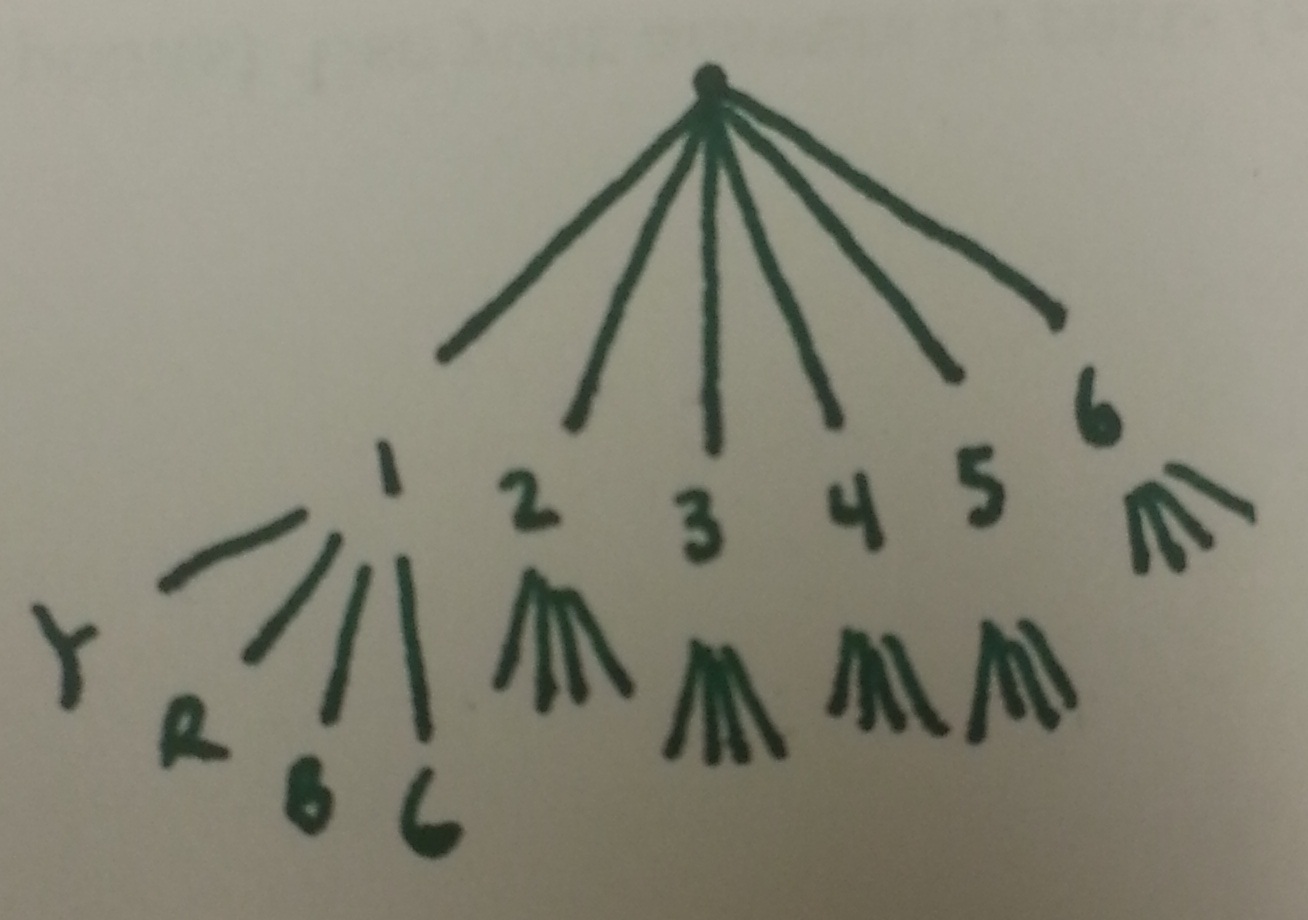
From this we see there are a total of 24 possible outcomes (count the lines at the bottom). There is exactly one way to roll a 5 and land on blue, so the probability being requested is 124=0.04166.