Back to the class
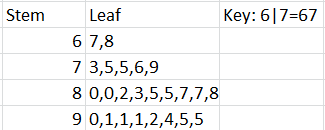
Section 2.2 #17: Use a stem-and-leaf plot to display the data.
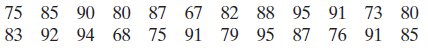
Solution:
Section 2.3 #20: Find the mean, median, and mode of the data:

Solution: For mean, calculate
$$\mathrm{mean}=\dfrac{63+49+36+43+52+43+38+50+40}{9}=\dfrac{414}{9}=46.$$
To find the median, first order the data:
$$36, 38, 40, 43, 43, 49, 50, 52, 63$$
From this we observe that
$$\mathrm{median}=43.$$
For the mode, observe that
$$\mathrm{mode}=43.$$
Section 2.3 #41: Find the weighted mean of the score being described:
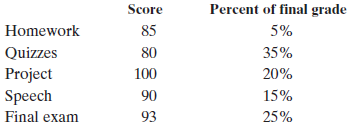
Solution: The weighted mean is calculated as follows:
$$\begin{array}{ll}
\mathrm{WeightedMean} &= \dfrac{85(0.05)+80(0.35)+100(0.2)+90(0.15)+93(0.25)}{0.05+0.35+0.2+0.15+0.25} \\
&= \dfrac{89}{1} \\
&= 89.
\end{array}$$
Section 2.4 #15: Find the range, mean, sample variance, and sample standard deviation:
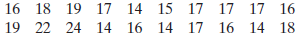
Solution: The range is given by
$$\mathrm{range}=\mathrm{max}-\mathrm{min}=24-14=10.$$
The mean is given by
$$\begin{array}{ll}
\mathrm{SampleMean}&= \overline{x} \\
&= \dfrac{16+18+19+17+14+15+17+17+17+16+19+22+24+14+16+14+17+16+14+18}{20} \\
&= \dfrac{340}{20} \\
&= 17.
\end{array}$$
To find sample variance, we compute
$$\begin{array}{ll}
\mathrm{SampleVariance} &= s^2 \\
&= \dfrac{(16-17)^2+(18-17)^2+(19-17)^2+(17-17)^2+\ldots+(14-17)^2+(18-17)^2}{20-1} \\
&= \dfrac{1+1+4+0+9+4+0+0+0+1+4+25+49+9+1+9+0+1+9+1}{20-1} \\
&= \dfrac{128}{19} \\
&\approx{6.7}
\dfrac{}{}
\end{array}$$
To find the sample standard deviation, we compute
$$\mathrm{SampleStandardDeviation} = \sqrt{\mathrm{SampleVariance}} = \sqrt{6.7}\approx 2.6.$$
Section 2.4 #21: Three histograms are shown. Which has the largest standard deviation? Which has the smallest standard deviation? Why?
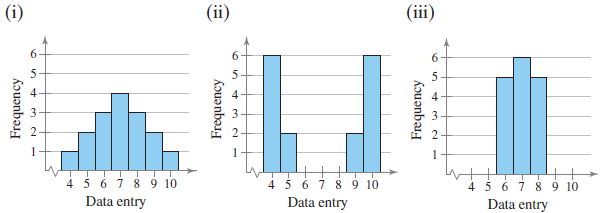
Solution: Data set (ii) has highest standard deviation -- the mean of the data will be near 6 or 7, but all of the data lies away from the mean. The data set (iii) has the least standard deviation -- all of the data is clustered together.
Section 2.4 #29: The mean speed of a sample of vehicles along a stretch of highway is 67 miles per hour, with a standard deviation of 4 miles per hour. Estimate the percent of vehicles whose speeds are between 63 miles per hour and 71 miles per hour. (Assume the data set has a bell-shaped distribution.)
Solution: Since the data is bell-shaped, we may use the "empirical rule". Since we know the mean and standard deviation, we are being asked "how many standard deviations from the mean are the numbers 63 and 71?". To figure that out, compute
$$\mathrm{mean}-\mathrm{standarddeviation}=67-4=63,$$
which is one of the numbers we are looking for. This means that $63$ lies within one standard deviation from the mean. Also the calculation
$$\mathrm{mean}+\mathrm{standarddeviation}=67+4=71,$$
also showing that the number $71$ lies within one standard deviation of the mean. By the empirical rule, the percentage vehicles whose speeds are between $63$ and $71$ in the data set is approximately $68\%$.
Section 2.4 #36: Old Faithful is a famous geyser at Yellowstone National Park. From a sample with $n=32$, the mean duration of Old Faithful's eruptions is 3.32 minutes and the standard deviation is 1.09 minutes. Using Chebychev's Theorem, determine at least how many of the eruptions lasted between 1.14 minutes and 5.5 minutes.
Solution: In this case we don't know the data is bell-shaped and so Chebychev's theorem is what we must use (instead of the empirical rule). We must determine the value of $k$ from that theorem (corresponding to the number of standard deviations we were looking for in the previous problem). Is $k=1$? To find out, compute
$$\mathrm{mean}-\mathrm{standarddeviation}=3.32-1.09=2.23,$$
which is not a number we are comparing to. So try instead
$$\mathrm{mean}-2\mathrm{standarddeviation}=3.32-2(1.09)=1.14.$$
This shows that "$1.14$ minutes" lies within $k=2$ standard deviations of the mean. Likewise, note that
$$\mathrm{mean}=2\mathrm{standarddeviation}=3.32+2(1.09)=5.5,$$
as expected. Therefore by Chebychev's theorem, the portion of the data lying between these values (i.e. "within $k=2$ standard deviations of the mean") is given by
$$1-\dfrac{1}{2^2} = 1-\dfrac{1}{4}=\dfrac{3}{4}=0.75=75 \%.$$
Since this problem asked specifically for the number of eruptions, we must use the sample size $n=32$ and the portion we have found, $75\%$ to calculate $75\%$ of $32$:
$$75\% \hspace{2pt} \mathrm{of} \hspace{2pt} 32= 0.75(32)=24.$$