Back to the class
Section 1.1 #18 : Is a population or sample being described in the following?:
The age of every third person entering a clothing store.
Solution: This is a sample because the age of all people who enter the store is collected, only a part of them.
Section 1.1 #42 : Is a parameter or a statistic being described in the following?:
In a recent year, the average math score on the ACT for all graduates was 21.1.
Solution: This is a parameter because the average math score of all graduates was used. If we had taken data from only some of the graduates, it would have been a statistic.
Section 1.3 #11: Is an observational study or an experiment being described?:
In a survey of $177,237$ U.S. adults, 65% said they visited a dentist in the last 12 months.
Solution: This is an observational study because no "treatment" was applied to the adults in the study (even though they may have received some kind of "treatment" when they were actually at the dentist -- focusing on that would be a *different* study).
Section 2.1 #12: Find the class width, lower class limits, and upper class limits when the minimum data value is $12$, the maximum data value is $88$, and you want $6$ classes.
Solution: First find the range:
$$\mathrm{range}=\mathrm{max}-\mathrm{min}=88-12=76.$$
Now find the class width:
$$\mathrm{class \hspace{2pt} width} = \mathrm{round} \left( \dfrac{\mathrm{range}}{\mathrm{number \hspace{2pt} of \hspace{2pt} classes}} \right) = \mathrm{round} \left( \dfrac{76}{6} \right) = \mathrm{round}(12.666)=13.$$
So the lower class limits are $12$, $12+13=25$, $25+13=38$, $38+13=51$, $51+13=64$, and $64+13=77$ and the upper class limits are $24$, $37$, $50$, $63$, $76$, and $89$.
Section 2.1 #20: Use the given frequency histogram to (a) determine the number of classes, (b) estimate the frequency of the class with least frequency, (c) estimate the frequency of the class with the greatest frequency, and (d) determine the class width.
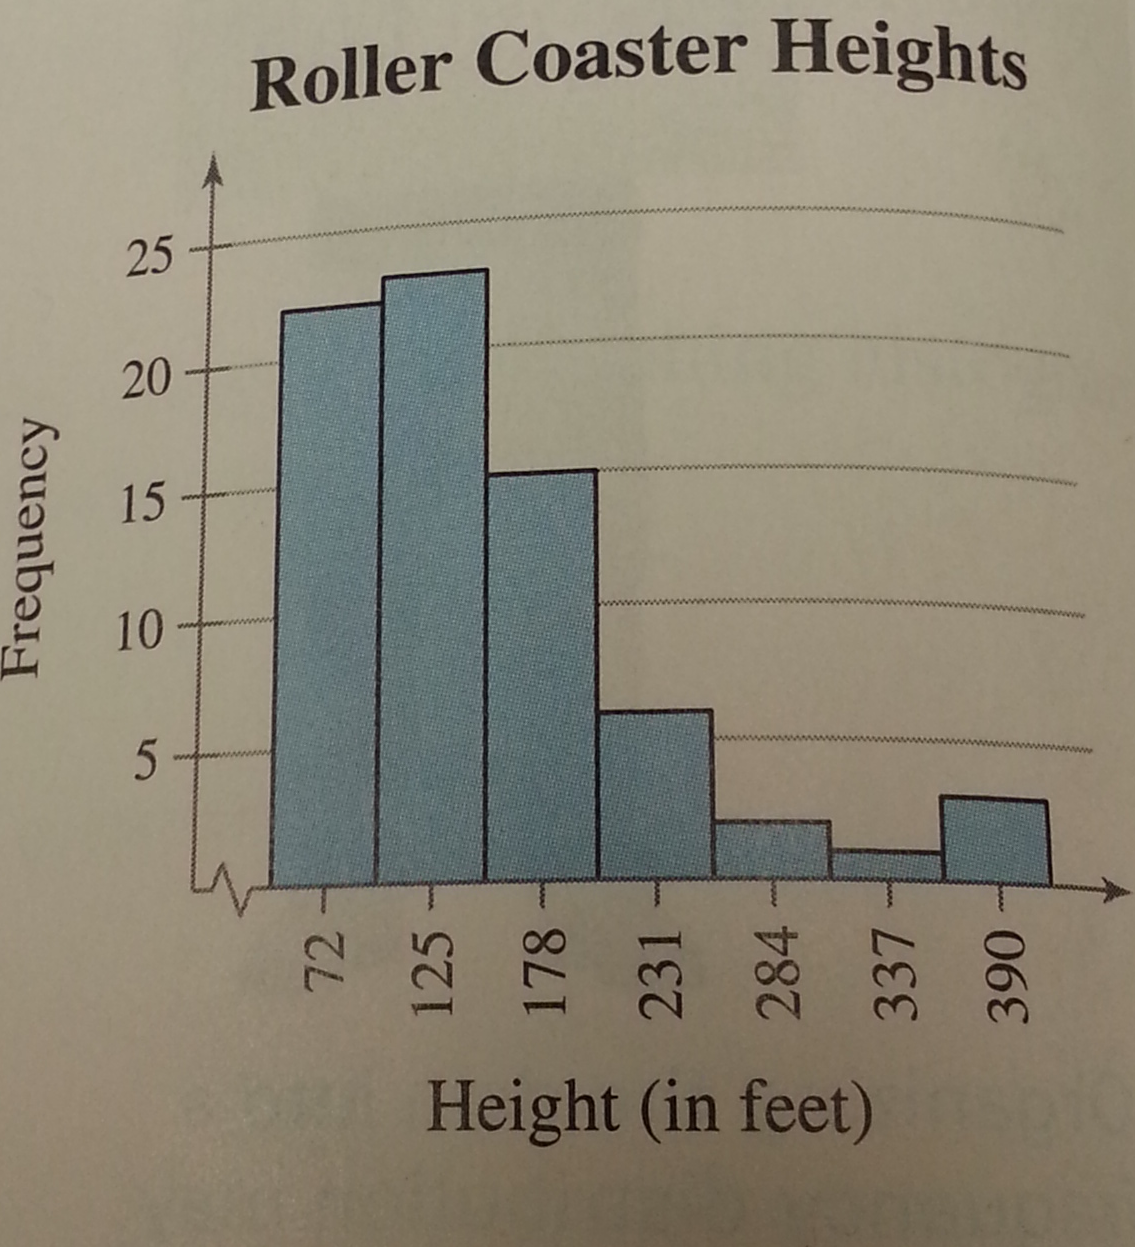
Solution: For (a), the number of classes in a histogram is simply the number of vertical bars, so the answer is 7. For (b), the least frequent class is the one with the lowest bar, which appears to have height approximately 1. For (c), the most frequent is the highest bar, which appears to have height approximately 23. For (d), since the class width can be found by taking the difference of and two consecutive data points listed on the bottom -- for instance do $125-72=53$ or $337-284=53$ to conclude that the class width is $53$.
Section 2.1 #21: Use the given cumulative frequency graph ("ogive") to approximate (a) the number in the sample, and (b) the location of the greatest increase in frequency.
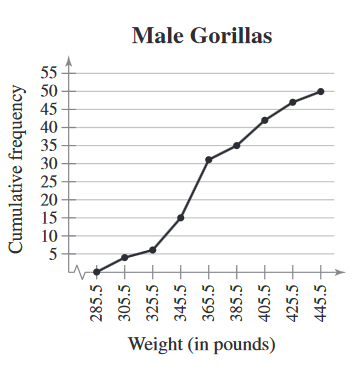
Solution: For (a), the answer is 50, since the cumulative frequency at any place sums the frequencies of all classes up to and including that place. for (b), we are looking for the line segment with largest slope (i.e. the "steepest" line segment). This is between 343.5 and 365.5 pounds.
Section 2.1 #32: Construct a frequency distribution and a frequency histogram for the data set using the indicated number of classes. Describe any patterns: pepper pungencies, number of classes: 5, data set: pungencies (in thousands of Scoville units) of 24 tabasco peppers:
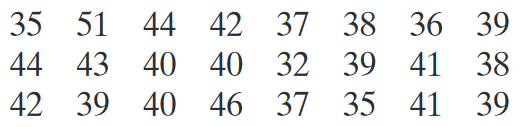
Solution: We want to have $5$ classes. To determine the class width, we first compute the range of the data set:
$$\mathrm{range} = \mathrm{max} - \mathrm{min} = 51-32=19.$$
So the class width should be
$$\mathrm{round} \left( \dfrac{\mathrm{range}}{\mathrm{number \hspace{2pt} of \hspace{2pt} classes}} \right)=\mathrm{round} \left( \dfrac{19}{5} \right) = \mathrm{round}(3.8)=4.$$
So our classes should have lower limits... $32$, $32+4=36$, $36+4=40$, $40+4=44$, and $44+4=48$. And the upper limits are $35$, $39$, $43$, $47$, and $47+4=51$. We combine this information into a histogram as drawn below:
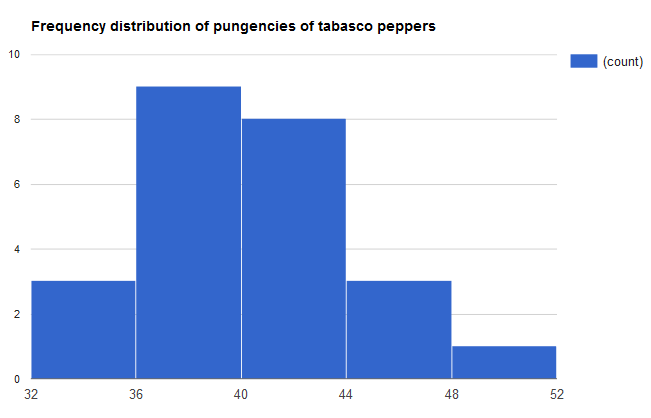
It appears that most tabasco peppers in the data set have between 36,000 and 44,000 Scoville units.