Back to the class
Section 2.4 #16: Find the amplitude and period of the function without graphing:
$$y=-3\cos(3x).$$
Solution: The amplitude is $3$. The period is normally $2\pi$ but the $3$ inside the cosine function makes the period $\dfrac{2\pi}{3}$.
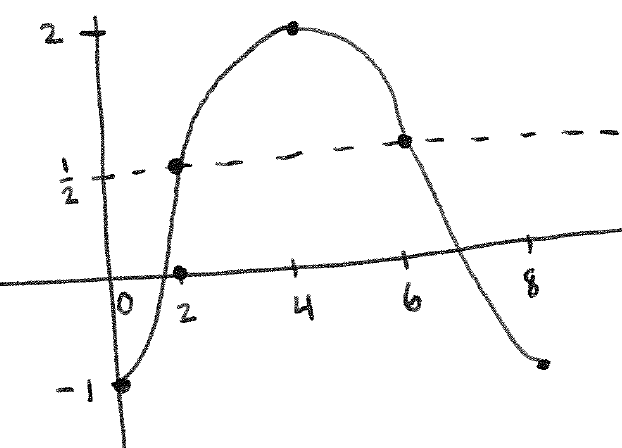
Section 2.4 #57: Graph $y=-\dfrac{3}{2} \cos \left( \dfrac{\pi}{4} x \right) + \dfrac{1}{2}$.
Solution: Our anchor points for this one are $0$, $2$, $4$, $6$, and $8$. We have a vertical shift of $\dfrac{1}{2}$ and an amplitude of $\dfrac{3}{2}$. The negative sign forces us to flip the graph upside down. We get the graph
Section 2.4 #64: Find an equation for the given graph:
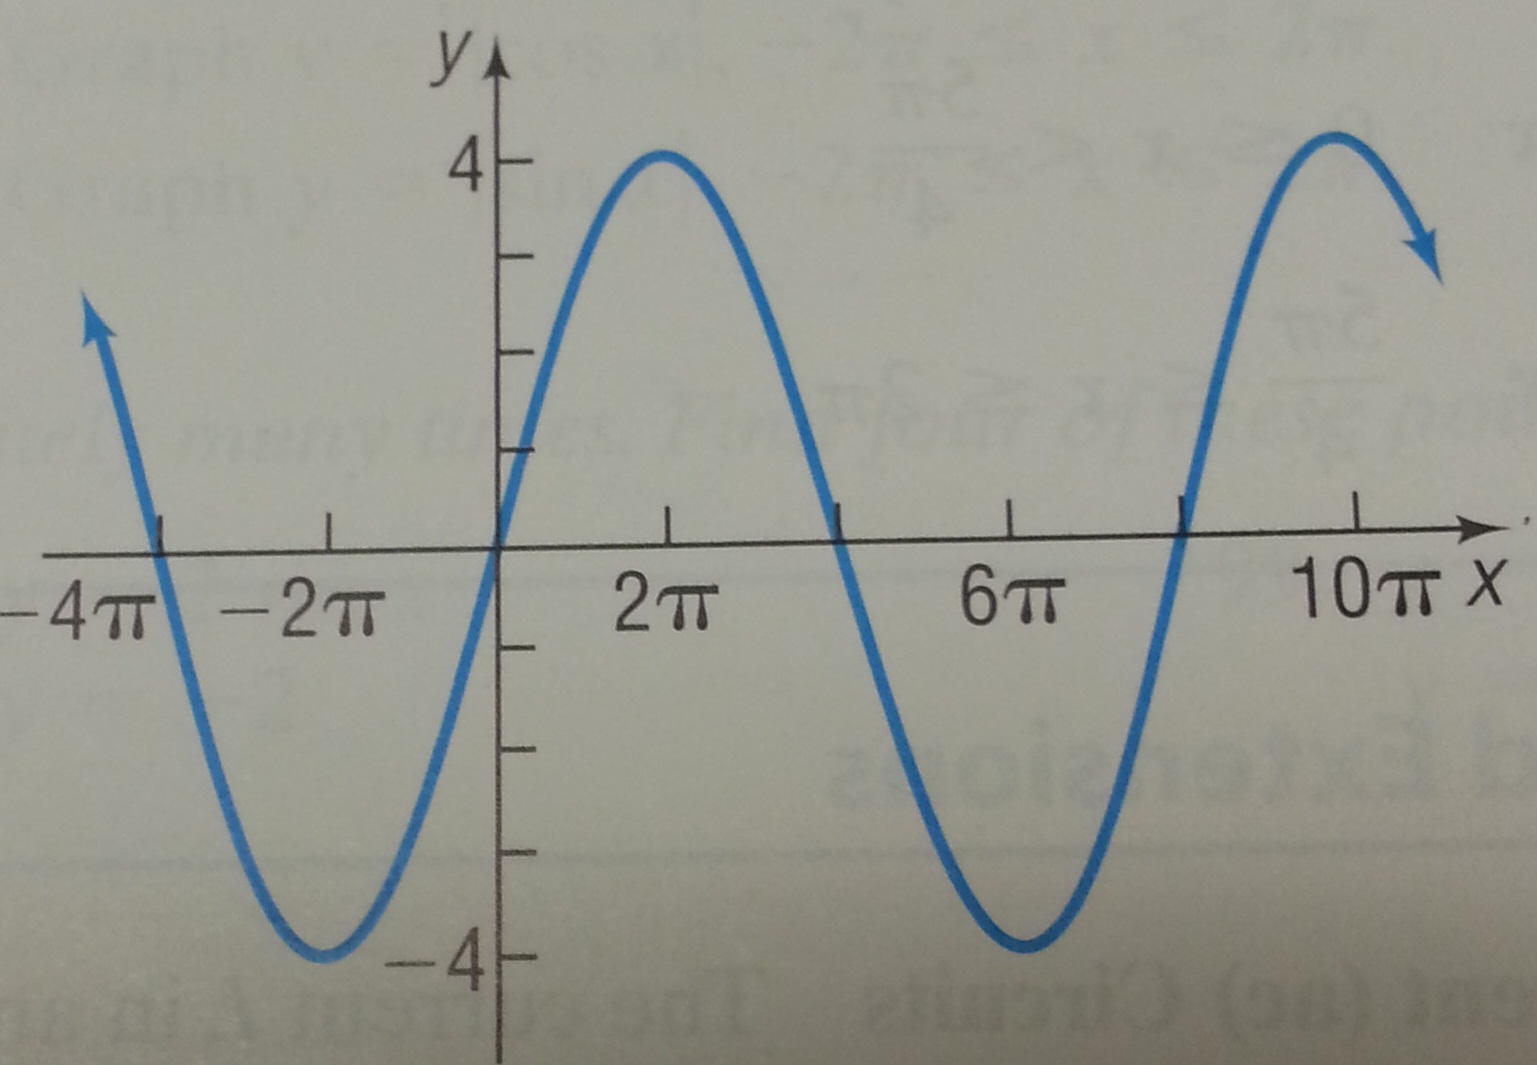
Solution: The graph has the shape of a sine graph. Let us focus on one period which appears to be from $0$ to $8\pi$. Thus the anchor points were $0$, $2\pi$, $4\pi$, $6\pi$, and $8\pi$. We ask the question: what $\omega$ has the property that $\sin(\omega x)$ has those anchor points?
Since the standard anchor points for sine are $0$, $\dfrac{\pi}{2}$, $\pi$, $\dfrac{3\pi}{2}$, and $2\pi$, we see that, for example, the second anchor point in the image, $2\pi$, must equal to the second "standard" anchor point divided by $\omega$: $\dfrac{\frac{\pi}{2}}{\omega}$. We are led to the equation
$$2\pi = \dfrac{\frac{\pi}{2}}{\omega}.$$
Solve this equation for $\omega$ to get $\omega = \dfrac{\pi}{2 \cdot (2\pi)}=\dfrac{1}{4}.$ We detect no vertical shift, but the amplitude is $4$. Therefore this is the graph of
$$y=4\sin \left( \dfrac{1}{4} x \right).$$
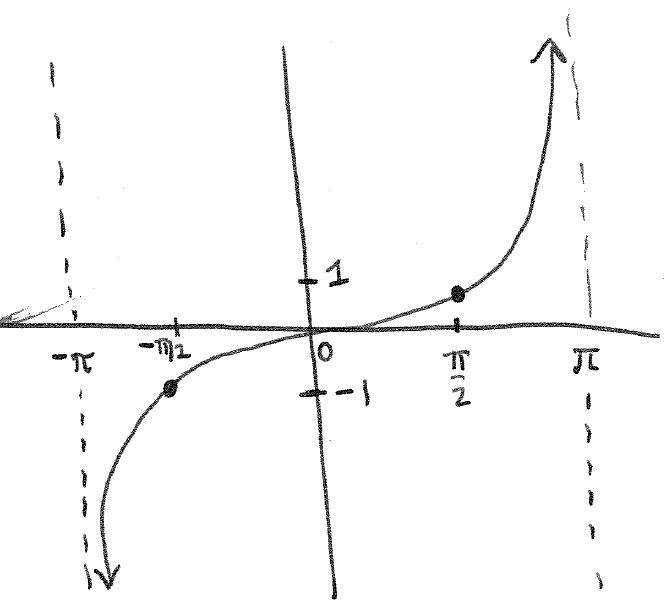
Section 2.5 #22: Graph $y=\tan \left( \dfrac{1}{2} x \right)$.
Solution: The anchor points are $-\pi, -\dfrac{\pi}{2}, 0, \dfrac{\pi}{2}, \pi$. Thus the graph is:
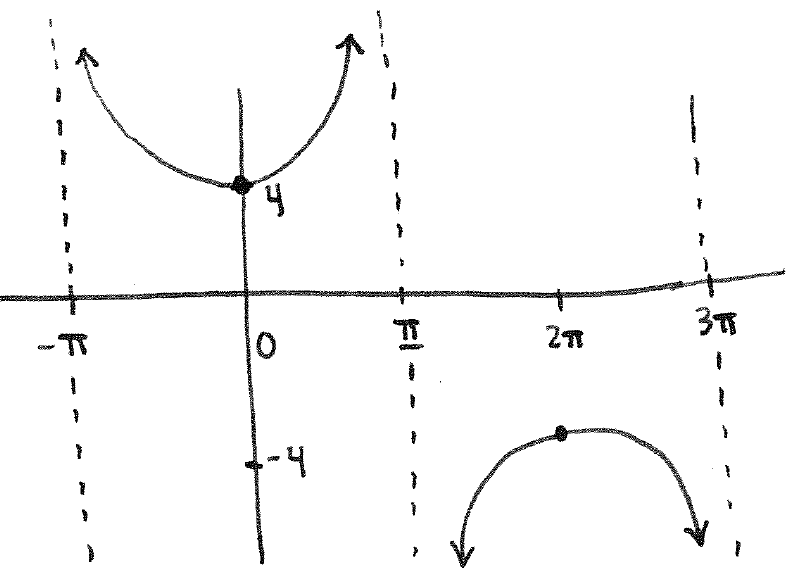
Section 2.5 #29: Graph $y = 4 \sec \left(\dfrac{1}{2}x \right)$.
Solution: The standard anchor points for secant are $-\dfrac{\pi}{2}$, $0$, $\dfrac{\pi}{2}$, $\pi$, and $\dfrac{3\pi}{2}$. Taking the $\dfrac{1}{2}$ inside the function into account gives us the new anchor points $-\pi$,$0$, $\pi$, $2\pi$, and $3\pi$. Therefore we get the following graph: